Access
http://www.catraining.net/HelpGuides/QRG/2013/cataccess.pdf
Excel
http://www.catraining.net/HelpGuides/QRG/2013/catexcel%20qrg.pdf
Outlook
http://www.catraining.net/HelpGuides/QRG/2013/catoutlook.pdf
Project
http://www.catraining.net/HelpGuides/QRG/2013/catproject.pdf
PowerPoint
http://www.catraining.net/HelpGuides/QRG/2013/catpowerpoint.pdf
Visio
http://www.catraining.net/HelpGuides/QRG/2013/catvisio.pdf
Word
http://www.catraining.net/HelpGuides/QRG/2013/catword.pdf
Quick start guides for office 2013 for office 2010, 2007 and even 2003 go to http://www.catraining.net/help.html for these and additional resources
Saturday 23 August 2014
Friday 18 July 2014
Using Excel Data for creating an Organization Chart in Visio
Using Excel Data for creating an Organization Chart in Visio
You’ve
painstakingly typed up all the organizational chart info in an Excel
spreadsheet and your boss says he’d like it in Visio. Groan – now I have got to retype it. Stop!
No you don’t. Visio allows you to
important names and titles stored in list format into Visio.
Here’s
how:
1.
Select
File, New, Organization Chart
2.
Start
the Organization Chart Wizard
3.
First
step: Select the 'Information that I
enter using the wizard' option, and click Next
4.
Second
step: Select Excel, then type the name
of the file
5.
Click
on Browse to choose the location you wish to save the file to, click Save, and
then click Next
6.
Click
OK - a Microsoft Office Excel workbook will open with column headings already
entered for you
7.
Replace
the sample text with the text you wish to appear in your organization chart. By
holding your cursor over each column heading, you should be able to view data
entry tips
8.
Save
the Excel file, then close
9.
Continue
through the remaining steps in the wizard to create your organization chart
from the data you entered into the Excel file
a. Visio's
organization chart wizard will recognise the following file formats (besides
.xls):
b. Microsoft
Exchange Server Directory (Microsoft Exchange e-mail Address Book)
c. Tab- or
Comma-delimited text (.txt)
d. Org Plus
(.txt)
e. Microsoft
Office Access (.mdb) or any other file format for a database created in an Open
Database Connectivity (ODBC)-compliant database application.
The Value of Pivot Tables
The Value of Pivot Tables
As a freelance trainer I often find delegates are
“frightened” of pivot tables. All those
buttons and new terminology. They
incorrectly think that using AutoFilter will give them equally effective
results. As a freelancer I used to shy
away from them too. Far too
complicated. That is until whilst
surfing on the net one day I came across a fantastically easy example. So now I always start with a very simplistic
example. Take a list of invoices with
date of invoice, company and amount paid.
There are over 600 lines of data but only 8 clients. From this we create a pivot table that gives
the total revenue for each company. 600
lines whittled down to 8 rows of data.
Wow! The delegate thinks – Cool –
this is easy and indeed it is. So we
play with that for a bit and then I say to them “Wouldn’t it be great if we
could find out the revenue per month?”
“Yes” they say. So then I get
them to add the Date field and group by month on it. They are then sold. Of course you can do so much more but first
you have to take away the fear. For
further help go to www.catraining.net
The Magic of DATEDIF
The Magic of DATEDIF
A frequent request I get is how to work out someone’s
age from that data of birth quickly and easily.
They’ve seen those long formulas involving integers and 365.25 –
scary. Isn’t there an easier way? Well – yes there is. Excel has an undocumented command called
DATEDIF which allows you to work out how many years, months or days there are
between 2 dates. Great! Tell me how.
Write your DOB in cell A1 (remember to type in date format) and =TODAY()
in cell B1. In cell C1 type this
formula: =DATEDIF(A1,B1,”y”) and as if
by magic your age appears. Easy
Peasy. For further help go to www.catraining.net
Access v Excel: When to Use Access
Access v Excel: When to Use Access
Due to
the learning curve involved many people use Excel for their database data when
it would be much more efficient using Access.
They are probably using Excel because they are comfortable with it and
do not have time to learn Access.
However in some areas Access is far more efficient managing large
amounts of data and the training investment would be well worth it.
Some
examples below:
·
You
have data that is constantly changing and you frequently need to produce reports
based on it. Your Reports and Queries in
Access are dynamic. What this means is
that you are storing the instructions and not the results. The results are only produced once you run
the report or Query. The benefit of this
is that if the data you are querying or reporting changes you do not have to
rewrite your reports and queries. In
Excel this would present you with quite a bit of extra work editing and
reformatting.
·
Creating
additional reports and queries is so much easier in access as it does not
involve creating links and transferring data.
·
As
you are able to store several tables within an Access database it enables you
to organise your data more logically and efficiently. Your Reports and Queries are able to
reference multiple tables in a much easier way than Excel.
·
If
you are using a version of Excel prior to 2007 you are limited to 65,536
records. Access is able to handle much
larger numbers.
·
With
a large amount of data Access will be much quicker at extracting records that
meet multiple criteria.
For
further information go to catraining.net
Avoiding Death by PowerPoint
Avoiding
Death by PowerPoint
Picture the scenario. You arrive for a Presentation. You walk into the room. And there whizzing about on the screen are
lots of jumping and spinning letters and graphics. Another PowerPoint treat!
To avoid boring your audience to
death take time when preparing your presentation and take into account the
following:
Slide Master
Use it! You can use this option to create a
consistent and clutter free look. Don’t
copy your logo onto every page. Put it
on the slide master and then it will appear on every page, in exactly the same
position and it will be the same size.
This will help prevent the messiness that occurs when different fonts,
colours and sizes appear on each page.
They don’t want your life story
Don’t write an essay on each
slide. Keep it simple! Just write short phrases and only include
essential information. Remember these
are prompts for your talk. If it is all
written then they don’t need to listen to you.
White Space
Make use of white space.
Avoid clutter. Use bold, italics
and shadow to enhance points. Avoid
using CAPITALS. Capitals do not make
text easier to read.
Don’t be too Fancy
The audience
is there to hear your message not to see how brilliant at PowerPoint you
are. Make a nice clutter free master
that uses contrasti ng colours for text
and background. Avoid patterned
backgrounds at all costs. It is often
though that dark text on a light background is best.
Don’t Make it Too Busy
Yes I
know. Animations, sound, transition –
it’s fun! Yes it is when you are
learning but not when you are presenting.
Keep those special effects to a minimum.
Use them sparingly and to highlight particular slides rather than every
one. Over use of animation and special
affects can look unprofessional and reduce your credibility.
If you
like this article go to www.catraining.net
for more useful tips.
Use of Images
When using
images whether they are clipart, graphics or photos ensure they are good
quality and that you have not distorted them when resizing or cropping. It is best not to use an image at all than
use a bad quality one.
What is Your Output?
Are you
presenting this on a large screen? If so
test it out! What looks good on your PC
screen may look totally different on the big screen. That nice photo may look grainy on the big
screen. Do not wait until the day to
find out.
How many slides???
Gosh –
do we really have to sit through 70 slides?
Yawn!!!! Don’t bore your
audience. Keep the number of slides down
and don’t be constantly flipping to the next slide.
Navigation Tools
Learn
how to use PowerPoint’s navigation tools effectively. Sometimes one of your audience may ask to see
the previous slide again. Make sure you
know the best way to navigate back and forth without it looking messy.
Do Not Read Your Slides
Your
slides are an aid memoire for your real content. The bullets are simply there as reminders for
topics on which you will enlarge.
Face Your Audience!
Don’t
look at the screen when talking. Look at
the audience.
Don’t Rely on Removable Media
If your
presentation is on a CD, USB or other form of removable media copy it onto the
hard drive of the system you will be presenting for. This will cut down the margin of error.
mc post
|
General Advice:
·
It is advisable that for
every presentation you create you should have a folder and in that folder you
should include all your graphic files, sounds, and movie files. This can be
done even before you start linking them into PowerPoint. You should also put in
this folder all the Word, Excel, PDF or any other type of files.
·
Always keep your version of
PowerPoint up-to-date use one of the site to do that:
·
If time and cost permits then always try to upgrade to the
most recent version of PPT as the latest versions will have very few
compatibility issues
·
Before saving always use the
compatibility checker. Unfortunately the PC version only lets you know the
issues raised in previous versions of PPT in Windows but the MAC PPT even
tells you the issues raised in PC version on PPT.
·
Some Compatibility issues are
non editable but still viewable. The Compatibility checker should point those
issues out to you. Typical examples are
Smart Art Graphics that are viewable but can not be edited in older
versions and Motion path animations that is allowed in PC PPT can be viewed
in Mac PPT but cannot be added or edited in Mac PPT.
|
|||
|
Category
|
General Compatibility
Issue
|
Issues in PowerPoint 2008 (Mac)
|
Issues in PowerPoint 2007 (Windows)
|
|
Fonts
|
·
Some fonts are incompatible
when used across platform
·
If the text is to tight
within fonts then either the Mac or PC PPt may add extra line in eth text
place holder
|
· Cannot embed True Type Fonts
· Open Type Fonts from Adobe’s Pro Font collection show on PPT 04
and 08 but do with PPT 01
|
|
|
General Advice:
Try to use fonts that are standard and
can be found in both Mac and PC. These fonts include Arial, Times New Roman,
Courier New, Verdana, Tahoma, Trebuchet MS, etc…
|
|||
|
Graphics
|
|
Don’t use PICT graphic
|
|
|
General Advice:
Use GIF, JPG and PNG that are compatible
on both OS platform. If you are using Illustrations then it is advisable to
use WMF or EMF formats
|
|||
|
Media (Videos and Audios)
|
Some video or audio are not supported in
PPT (Both Versions)
|
|
|
|
General Advice:
·
Stick to the video formats
such as MPEG that can be played in Windows Media as well as Quick Time thus
being compatible in both OS Platform.
|
|||
· If possible use the DRM-free MP3 for audio files
Sections in MS PowerPoint 2010
Sections in MS PowerPoint 2010
It is very all to easy to lose you place in
a large MS PowerPoint presentation especially in a collaborative project.
Fortunately In MS Office 2010 Microsoft has created the capacity to group
slides into sections for the first time.
MS PowerPoint 2010 allows the grouping of
slides into different categories like Introduction, part 1, Part 2, Conclusion.
Allowing the author(s) to organize and arrange slides into sections to easily
manage them.
Adding a Section to a PowerPoint 2010 Presentation
Sections can be added from the ‘Add
Section’ button from the Slides section found on the Home ribbon. As an
alternative you can also right click on a slide and select ‘Add Section’ from
the context sensitive menu that appears.
Manipulating sections in PowerPoint 2010
The
Slides Panel View allows the user
to view a section once created. It is possible to Rename and rearrange sections by dragging up or down
with the Mouse . The same view facilitates collapsing or expanding a section.
This is a improvement on previous version on organizing your presentation by grouping
related slides within one section. Whilst this feature allows for ease of
finding, printing and editing slides this option is not compatible with creating custom screen
shows comprising of different sections.
To summarize Sections are like folders to organize your files. You could
even assign sections to colleagues to clarify who is editing which section of a
large presentation.
We have established that Sections can be printed.
But not synchronized set up as a Custom
Slideshow. As a good alternative sections can be hidden just as a single slide
can be hidden from a screen show..
Detailed Instructions on Creating a PowerPoint 2010
Section
To create a new section in PowerPoint 2010
follow the instructions below.
Select the area between the slides you wish
to separate in the Slide Sorter View
Ensure that the Home tab is selected and click on the Section icon. From the menu
appears, select “Add Section”. The section appears as a bar dividing the
slides.
Renaming Sections in PowerPoint 2010
Each section starts life as a “Untitled
Section”. By default all of the slides after the section name will be
automatically part of that section.
To rename the section. Just choose right
Click and “Rename Section”.
Expanding and Collapsing Sections
You can right click a section and Choose Collapse
All to collapse al sections in the presentation.
With all sections collapsed the section
name shows the number of slides in the section automatically to the right.
Individual sections can be expanded or collapsed
Moving Sections
and sections can easily be dragged into
different orders.
Apart from clicking and dragging. The
context menu allows you to move sections up or down.
If you need more help you are welcome to
our training manual for free and quick card. If you want a course follow the
link below for Mouse
What is SharePoint?
What is SharePoint?
Microsoft SharePoint 2010
makes it easier for people to work together. Using SharePoint 2010, you can set
up Web sites to share information with others, manage documents from start to
finish and publish reports to help everyone make better decisions.
SharePoint isn’t a
program, its platform and is a collection of many products and technologies.
SharePoint is a server product, which is shared across your network accessed
through office programs or via the Internet.
SharePoint is split into
6 areas;
Site – SharePoint allows you
to create websites. You don’t need to be a web designer to create these
websites as they are easily changeable.
Communities – SharePoint helps you
work together with other people – shared documents, calendars, task lists and
calendar boards.
Content – SharePoint gives you a
place to put your content. The documents you store on SharePoint can be
accessed by other users and changed in real-time.
Search – SharePoint has a
complex smart search engine that allows you to securely search your content in
multiple ways as well as other colleagues’ documents too.
Insight – SharePoint helps to
bring all your information together and understand it better. It organises
documents and presents it in a way that makes sense. Data can be combined into
reports so that you can understand the information you have.
Composites – SharePoint can be
extended and customised without being a programmer. SharePoint can talk to your
systems and databases.
Why use SharePoint?
The capabilities of
SharePoint 2010 work together to help your company quickly respond to changing
business needs. Using SharePoint 2010, your people can share ideas and
expertise, create custom solutions for specific needs and find the right
business information to make better decisions. For IT, SharePoint 2010 helps
you cut training and maintenance costs, save time and effort and focus on
higher business priorities.
Ribbon Flexibility
Ribbon Flexibility
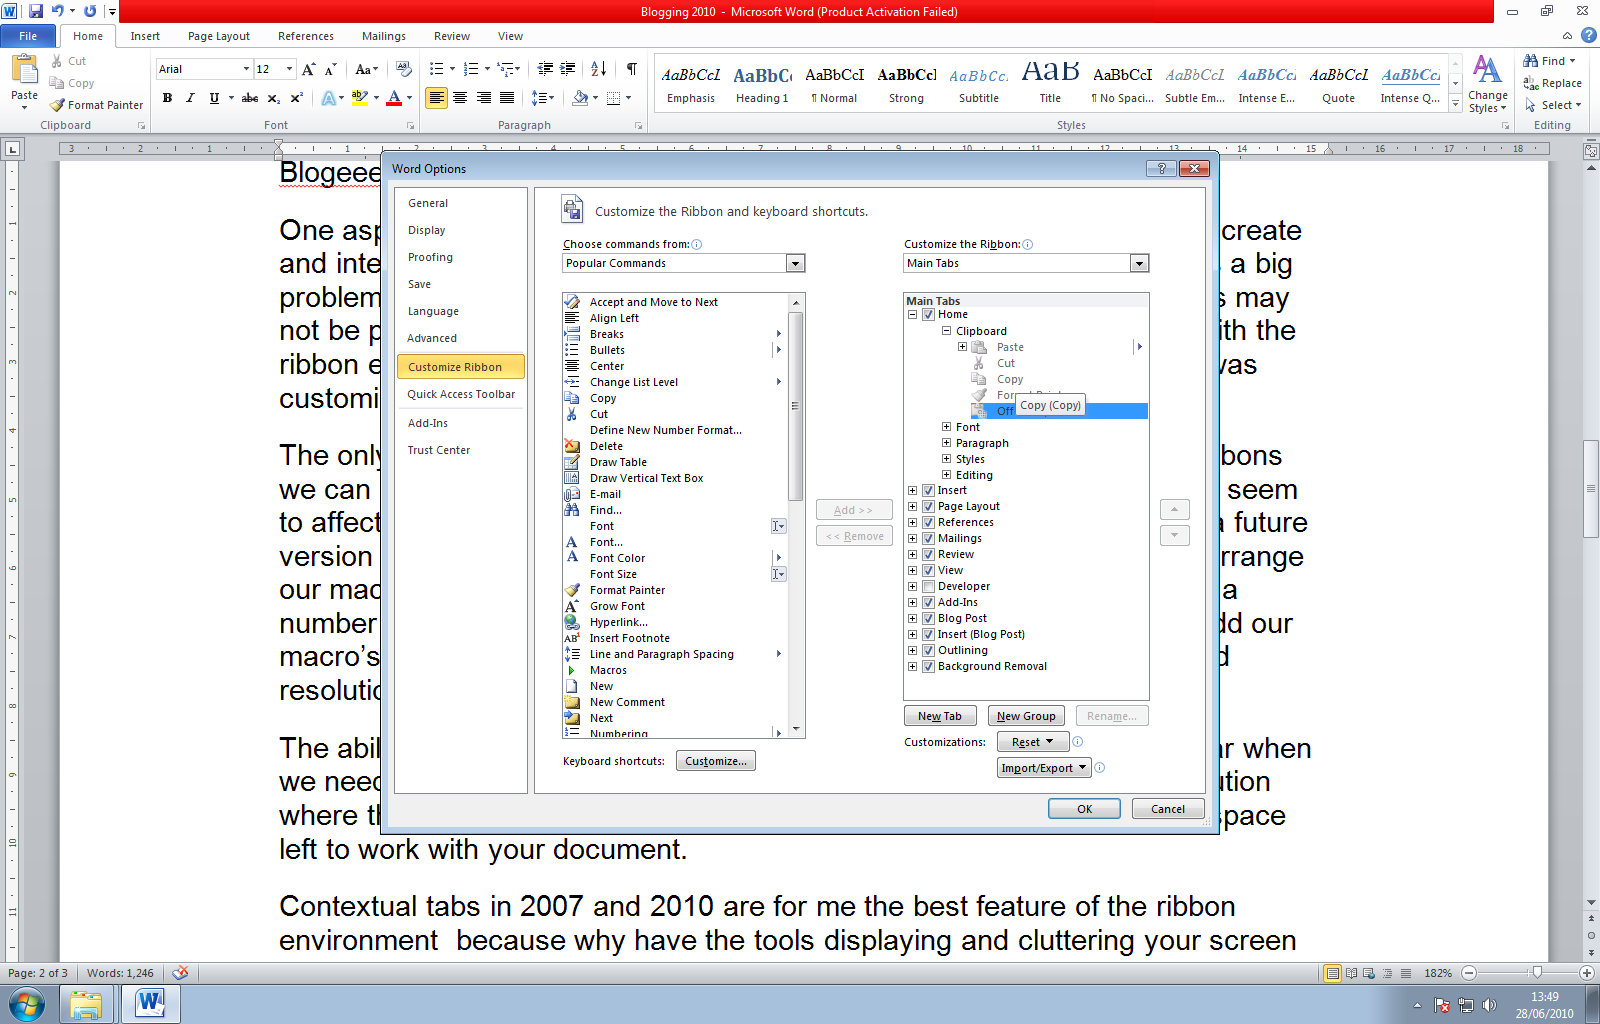
One aspect I am glad to see has been addressed in 2010 is the ability to create and interact more with the ribbon environment and customize it. This was a big problem with Office 2007. Although the arrangement of tools and features may not be perfect in 2010 at least we have some degree of customisability with the ribbon environment. (As well as the Quick Access toolbar but since that was customisable in 2007 I’ll mention it no further here.)
The only problem I can still see is the
inability to customise the default ribbons we can make them not visible and
create our own instead, but we cannot seem to affect the prelayout of existing
ribbons. (Maybe that’s being saved for a future version of office) At least we
can create our own macro ribbon now and arrange our macro types in groups and
export these items for deployment across a number of machines. This was a big
problem in 2007 as we could only add our macro’s to the Quick access toolbar
which, dependant on screen size and resolution has a very finite number of
spaces and no organisation.
The ability to Minimise the ribbons as we
work and only have them appear when we need them is useful for those with
limited screen size or a large resolution where the ribbon could use up to a
third of the screen, leaving very little space left to work with your document.
Contextual tabs in 2007 and 2010 are for me
the best feature of the ribbon environment
because why have the tools displaying and cluttering your screen when
you don’t need them the ability of the office applications to determine the
object type and display the appropriate tools in the contextual tabs is great.
In previous office versions it was normal to see the toolbar area crowded with
10 – 15 toolbars that were used very infrequently but still around ‘Just in
case’. I have seen many mentions on the web from people saying they can’t find
things and they hate the whole ribbon idea but I believe that given the chance
to use and work with the 2010 features for the ribbons and toolbars for a while
they will be converted and actually start to appreciate the improvements and
will eventually wonder how they managed before.
Spark lines Excel 2010
Blog 1
 |
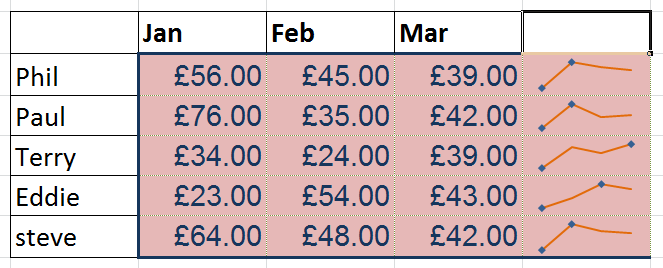
Just a few words about the new Excel 2010. I believe it’s the best one yet with some new tweaks to update the previous 2007 version to a completely new application compared to the old clunky 2003 version. I particularly liked the Sparklines which made a good deal of sense and quickly transformed my Data into something visually informative at the click of a button. It was far preferable than having to go through the hassle of inserting a whole chart into the sheet just to give a quick glimpse of the data trend.
Sparklines in an excel spreadsheet (2010)
The clean and simple use of
the standard and contextual tabs makes a pleasant experience (for me) in using
any of the 2010 office applications. The Ability now to create and customise
your own Tabs has rectified one of the main failings of the office 2007
environment. The fact that this environment of the Microsoft office ribbon has
gone right through the whole application range is all to the good. The ability
to also import and export these customisations to the ribbon makes deployment
of standard ribbons across a business with macro, template and standard
business styles buttons absolutely brilliant.
Monday 30 June 2014
We all like freebies and when it comes to excel this is an area we like to look at everyone knows about the excel function dictionary well its been taken to the next level a jump from the original 150 pages to almost 500. Done primarily in html the guys at cat training assure me that a new excel version will be available in the fall, for the mean time you can access free help to excel via http://www.catraining.net/excelFunctions/excelfunctionindex.html Cat training wish to empower our clients to see a list of our current courses available please go to http://www.catraining.net/programme-index.html we are also making available training manuals for office 2003, 2007 and 2010 at http://www.catraining.net/CourseMaterials/TrainingManuals.html
Subscribe to:
Posts (Atom)